Happiness at Work Pays Off Three Times Over
Published at May 3, 2026 ... views
Most arguments for happiness at work end up in the same place: a pile of statistics about how happy employees are "X% more productive" or "Y% more creative." I'm sympathetic to the conclusion, but the format is suspicious. Numbers like that tend to get traded around in TED-style talks until nobody knows where they came from anymore.
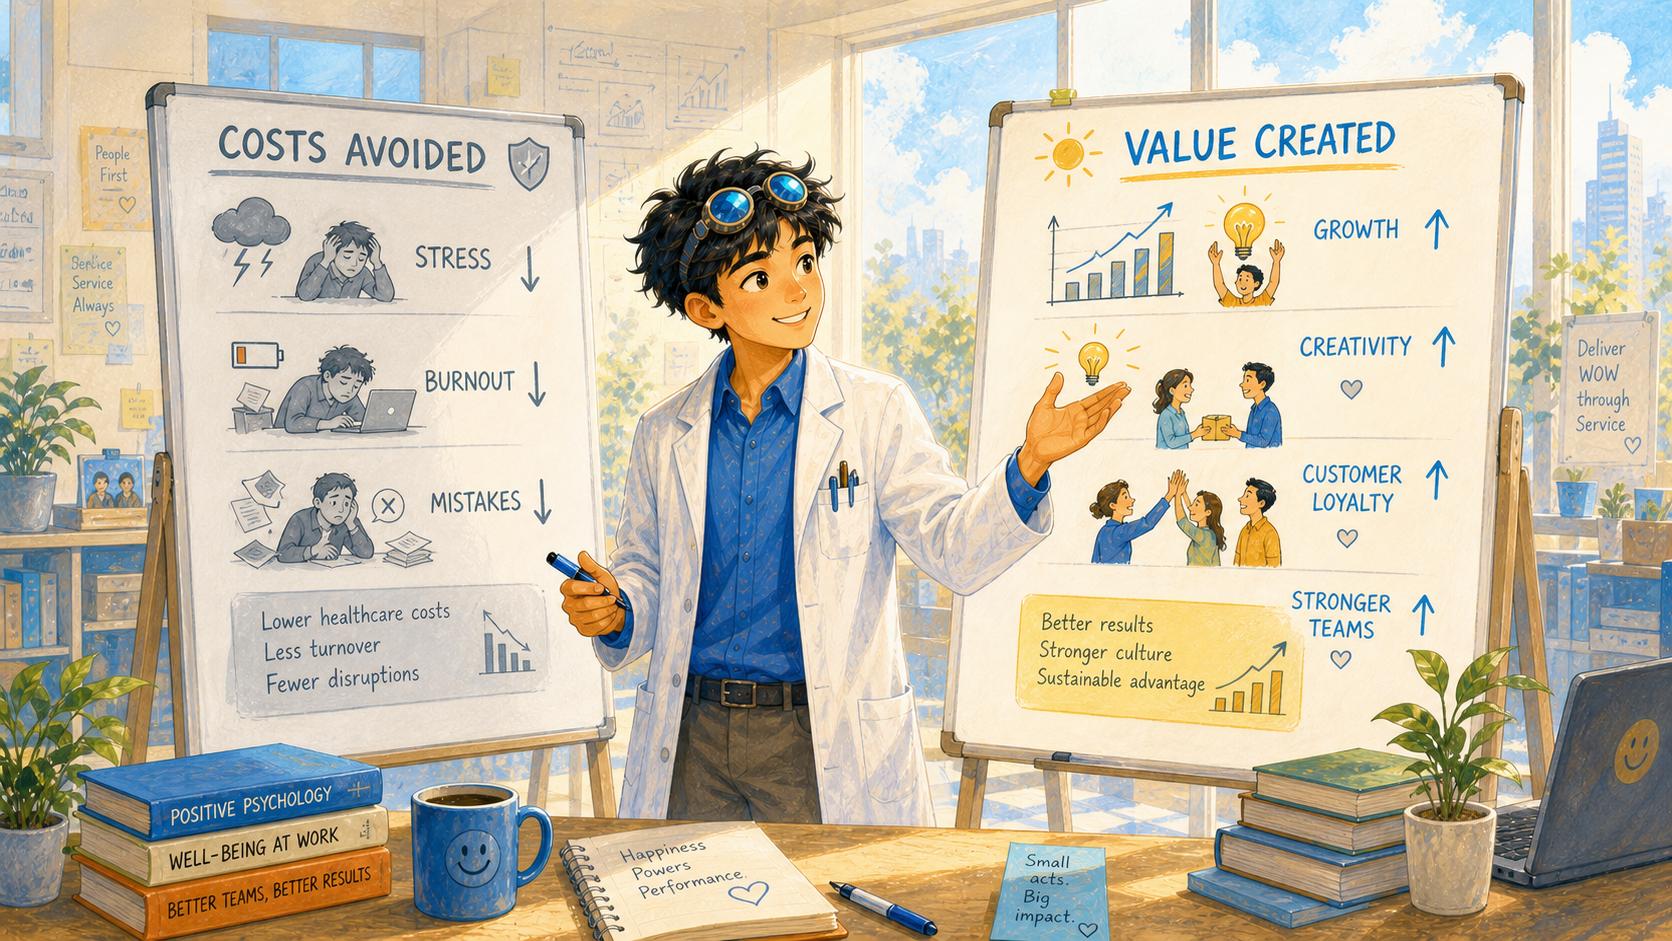
So when I went back through Emiliana Simon-Thomas's lecture on the advantages of happiness at work, the question I was trying to answer wasn't whether there's an upside. The previous post in this series already covered the seven problems happiness solves, which is the defensive case — every cost happiness reduces. That argument is real.
The harder question is the offensive one: does happiness at work create new value on top of avoiding harm, or is it riding on the coattails of well-managed companies?
The reframe I'm taking from her lecture: the conventional view treats happiness at work as a downstream perk that follows from good management. The evidence flips that — happiness is an upstream driver, and the three scales it operates on are coupled in ways most management metrics treat as separate. That's a stronger claim than "happy workers are nicer," and it's the version a thoughtful skeptic should be able to push back on. The studies underlying each scale come from different researchers, different decades, and different methodologies, all converging on the same shape — that convergence is what changed my mind, more than any single statistic.
Achor's twelve-minute talk states the thesis more aggressively than I will: "we've got the formula backwards — success doesn't cause happiness, happiness causes success." It's the most-watched workplace-happiness talk on the internet, and it's the strongest version of the claim this post tries to defend.
The shape of the argument: three scales, not one number
The first thing that helped me was seeing the structure before any of the data. Simon-Thomas's lecture is organized around three nested scales, and the evidence at each scale answers a different question.
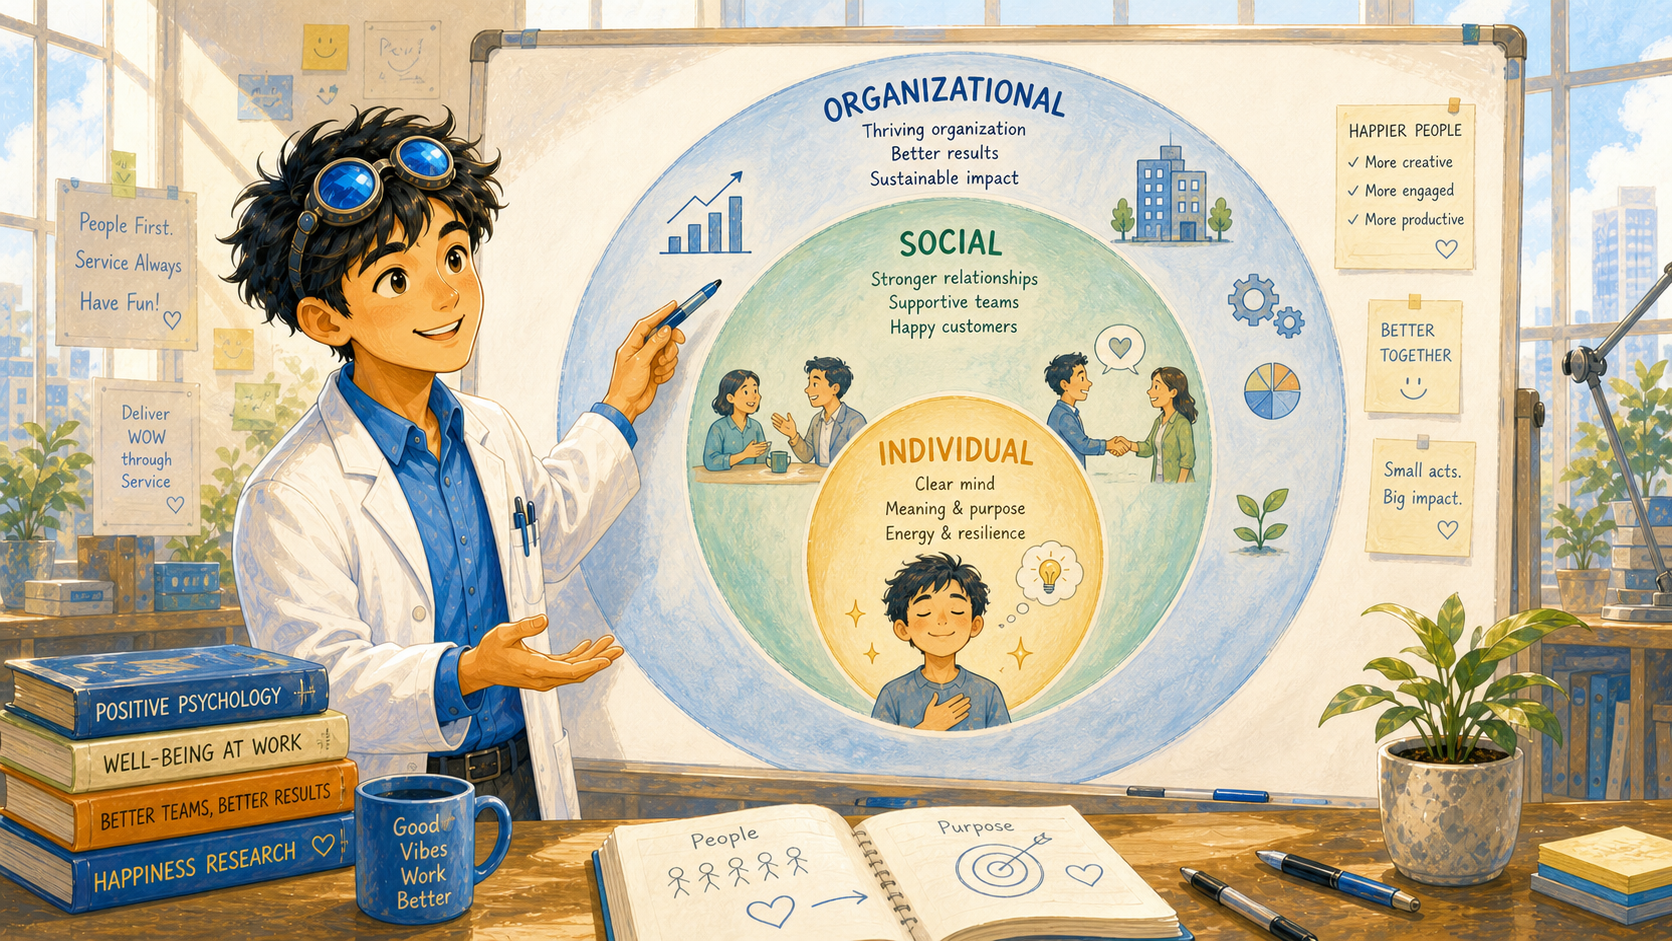
That structure matters. A skeptic can wave away one statistic — anyone can. It's much harder to wave away the same shape showing up in physiology studies, social-psychology field studies, and corporate-finance panel data, with no shared authors and no shared incentive to reach the same conclusion. So I want to walk each scale with that bar in mind.
The individual scale: what happiness does to one person at work
The cleanest place to start is inside one person. Most of the readership on workplace happiness skips this scale and jumps straight to the bottom-line stuff, but the bottom-line stuff doesn't make sense without it.
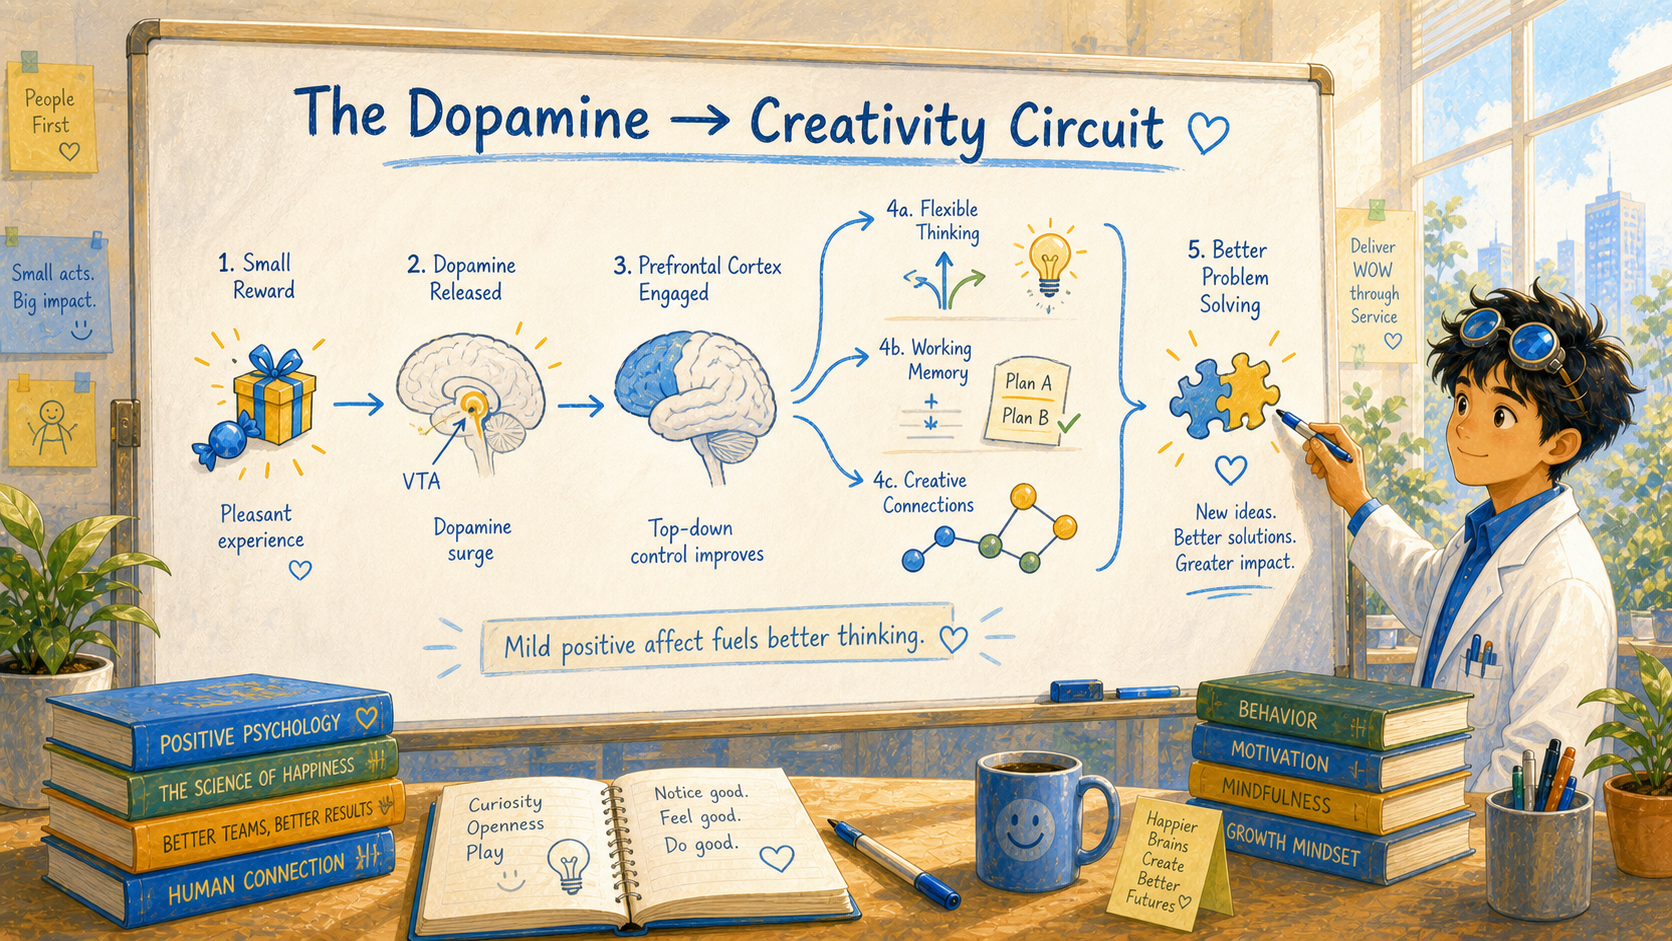
Mild positive affect changes how the brain handles a problem
Mild positive affect changes brain chemistry in ways that change the cognition that follows. That mechanism is the part I underweighted before reading Ashby, Isen & Turken's 1999 Psychological Review paper. They argue that mild, everyday positive affect — the kind induced by something as small as an unexpected gift — increases dopamine release in frontal regions like the anterior cingulate, which in turn improves cognitive flexibility, working memory, and creative problem solving. Importantly, they show that the effect is not the same as arousal: people who exercised before a creativity test, or who watched a distressing film, did no better than controls, while people in the positive-affect condition outperformed both.
This is the mechanism behind one of Alice Isen's most famous studies. Her team gave practicing physicians a small bag of candy before a diagnostic challenge. Compared to physicians who got no candy, the candy group reached more accurate diagnoses faster, and they were less easily thrown off by misleading information embedded in the case. That study isn't soft. The participants were actual doctors and the task was real diagnosis.

A productivity number with a randomized lab behind it
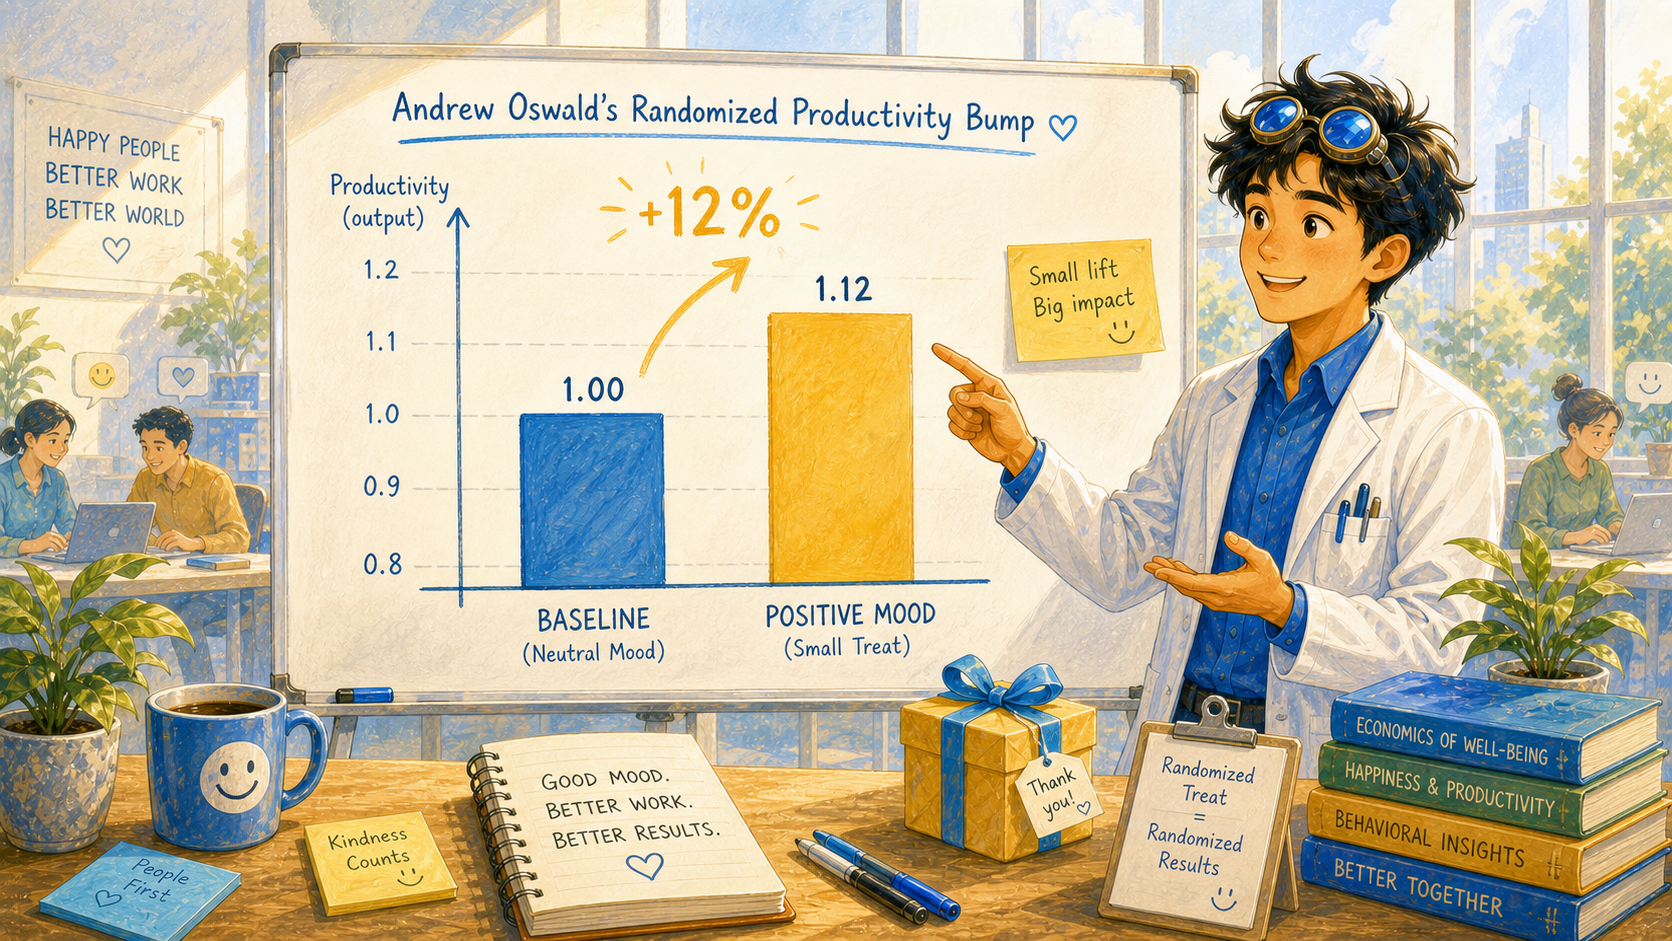
The 12% productivity figure is one I'd usually be skeptical of, until I traced it back. Andrew Oswald's team at the University of Warwick ran a series of randomized lab experiments published in the Journal of Labor Economics in 2015 where they induced positive affect (via a comedy clip or a small gift) and measured output on a standardized task. Mood manipulation produced a roughly 12% rise in productivity, with no equivalent rise in either the placebo or in a separate group asked to recall a sad experience.
That's not a correlation pulled from a survey. That's an experiment with random assignment.
Small wins beat motivational posters
Teresa Amabile, in The Progress Principle (Harvard Business School), makes the point that small everyday wins are the strongest predictor of inner work life — including creativity, engagement, and follow-through — across the diary entries of more than 200 knowledge workers her team tracked. One small completed task can lift creativity for days. And in her data, supervisors who saw their employees as happier also rated them as more creative on independent assessments.
What clicked for me here is the asymmetry. Daily small wins beat the rare big nudge. The implication for managers is not "throw a giant offsite." It's "let people finish things."
Resilience comes from satisficing, not from grit
Happier people recover faster from setbacks not because they're tougher, but because they're satisficers rather than maximizers — they don't burn the energy chasing the absolute best option when a workable one is in front of them. Barry Schwartz makes the case in The Paradox of Choice: maximizers report lower well-being and higher regret across multiple domains, including work decisions, precisely because the search itself is exhausting.

That's a useful corrective to the "happy people are just lucky" framing. They're often making different decisions — and those decisions conserve the energy that lets them recover faster from setbacks.
Career trajectory is downstream of mood, not upstream of it
The career-success arrow runs from happiness to outcomes more often than the other way — which inverts the standard advice to suffer through unfulfilling work for the credential. Sonja Lyubomirsky's longitudinal work — summarized in her 2008 book The How of Happiness — finds that people who report higher happiness early on go on to have measurably higher incomes years later, controlling for plausible confounders.
The thread tying these individual-scale findings together is that happiness changes the inputs — attention, flexibility, recovery, decisions — that downstream career outcomes are made of.
The social scale: what happiness does between people at work
If the individual scale is about what happens inside one head, the social scale is about what happens in the small space between two people sitting next to each other. This is where the gains start to multiply, because effects on one person spill into the people around them.
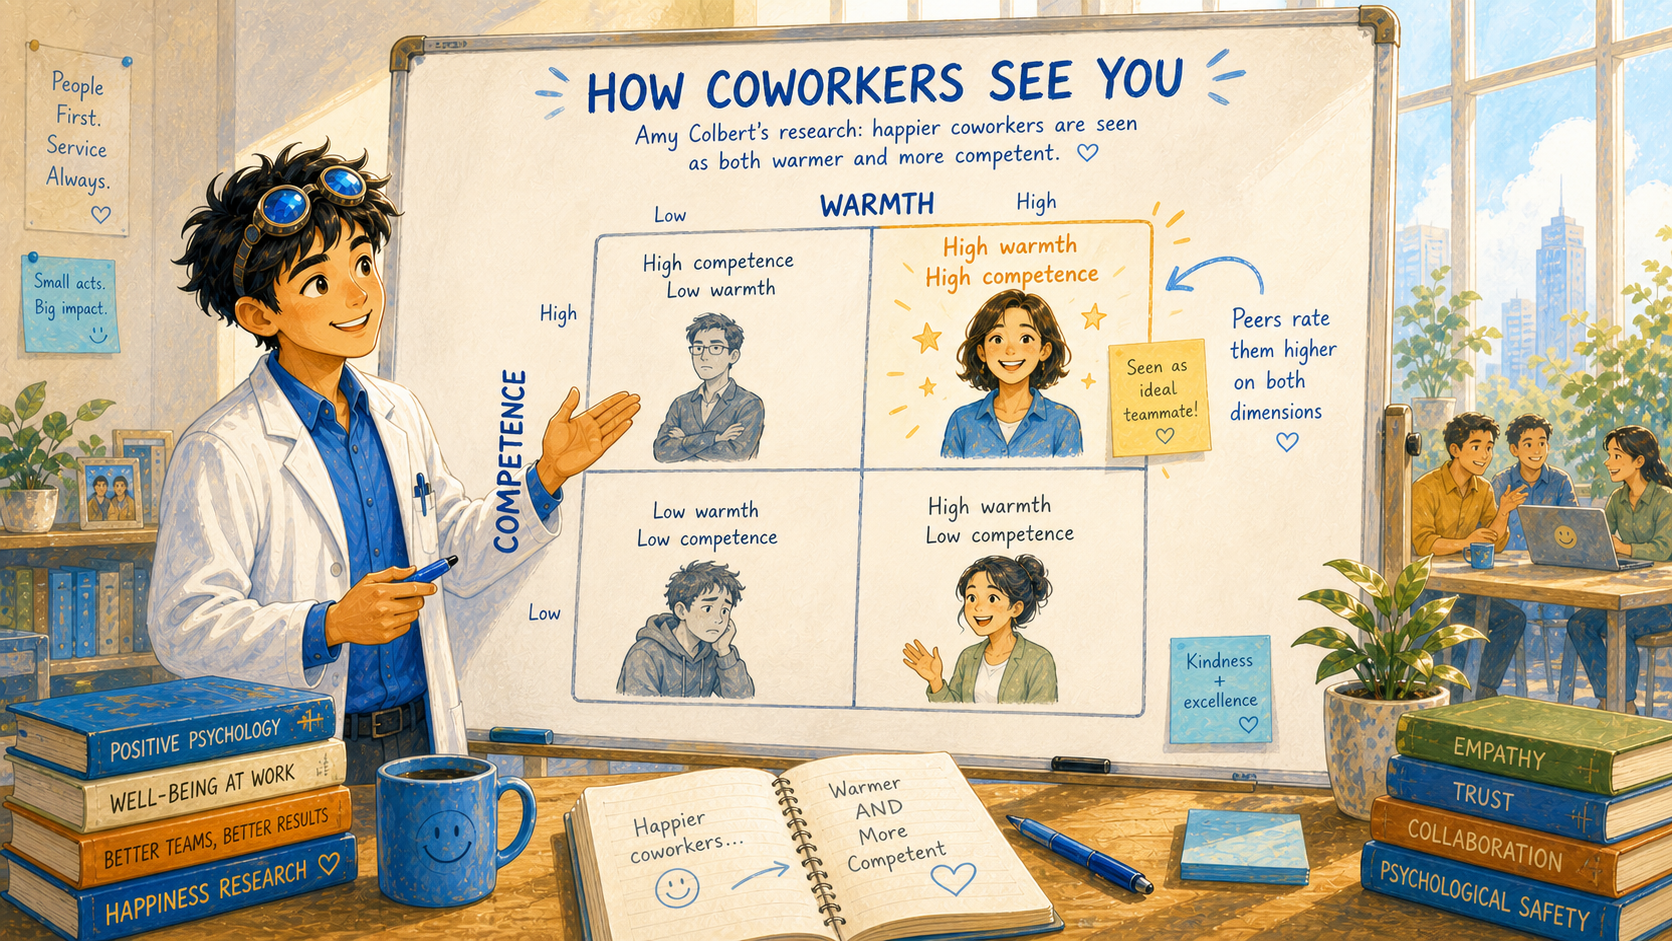
Happier coworkers are read as more competent, not less
The "happy-go-lucky" stereotype is a stereotype, not a finding — peers consistently rate happier colleagues as more competent, not less. Amy Colbert's 2016 Academy of Management Journal paper, "Flourishing via Workplace Relationships" is the cleanest synthesis: peers rate happier colleagues as more socially appealing, more trustworthy, and — counterintuitive given the stereotype — more competent. The competence rating is the part that landed for me. I'd assumed cheerful people got marked down on seriousness. The opposite shows up in the data.
Supervisors evaluate happier employees more favorably
Colbert and others also document that happier employees receive better evaluations from supervisors on the quality of their work, their productivity, and their dependability. That isn't a self-report — it's an external rating from someone with a budget incentive to evaluate accurately.
Customers feel it through the wall
Jim Harter, Gallup's chief scientist, reported in 2017 that business units with higher employee engagement achieve roughly 10% higher customer ratings. That's not a marketing-survey claim. Gallup's database links unit-level engagement to unit-level customer outcomes across hundreds of organizations. The signal is that happiness at the staff level is felt by people who never meet the staff personally.
The implication that landed for me: customer satisfaction is partly a byproduct of internal employee experience. It's not a separate program.

Negotiation gets easier when one side is happier
Happier counterparts in a negotiation reach more agreements, close more deals, and report greater willingness to engage with the same person again. Carnevale & Isen's 1986 integrative-bargaining study is the canonical lab demonstration: positive-affect negotiators were significantly more likely to find joint-gain solutions that pure-position bargainers missed.
That sounds like a soft claim until you remember what an integrative-bargaining task actually measures: the ability to make tradeoffs of differing values, see new possibilities, and reason flexibly about how value should be split. Those are the same cognitive processes Ashby and Isen attribute to dopamine in their 1999 paper. The negotiation gain isn't a separate effect — it's the same individual-scale flexibility applied to two people at once.
People want to help happier people
Peter Salovey, who co-developed the modern theory of emotional intelligence and is now president of Yale, wrote in 1990 that "people are more likely to want to become friends with, and to provide emotional and tangible assistance to, individuals with a positive outlook." That's not a feel-good observation — it's a measurable asymmetry in who gets help when they ask.
The mechanism connecting these social-scale findings is straightforward: happiness changes the signal a person broadcasts in routine interactions. Other people respond to that signal with cooperation, with help, and with charitable interpretations.
"Thriving" puts numbers on the social scale
Spreitzer and Porath's 2012 Harvard Business Review article, Creating Sustainable Performance, gives the social-scale story numerical form. Across seven years of surveys spanning 1,200 white- and blue-collar employees, they found that thriving employees — those scoring high on both vitality (feeling alive and energized) and learning (growing and gaining new skills) — demonstrated 16% better overall performance, 125% less burnout, 32% more commitment to the organization, and 46% more job satisfaction than peers.
The "so what" line they draw is operational: thriving doesn't fall out of the sky. It's produced by four conditions managers can deliberately create — decision-making discretion, sharing information about the organization's strategy, minimizing incivility, and offering performance feedback.
That's the part I want to flag. The social scale isn't a mood — it's a measurable performance gradient with named levers.
The organizational scale: what happiness does to a company
If the social scale shows happiness rippling between two people, the organizational scale asks what happens when those ripples are summed across thousands. That sounds like a continuous extension, but it isn't — the studies at this scale treat an entire company as the unit of observation, and the failure modes are different too. This is also the scale most outside writing about happiness at work jumps to first, which is why I wanted to slow down on the previous two before getting here.
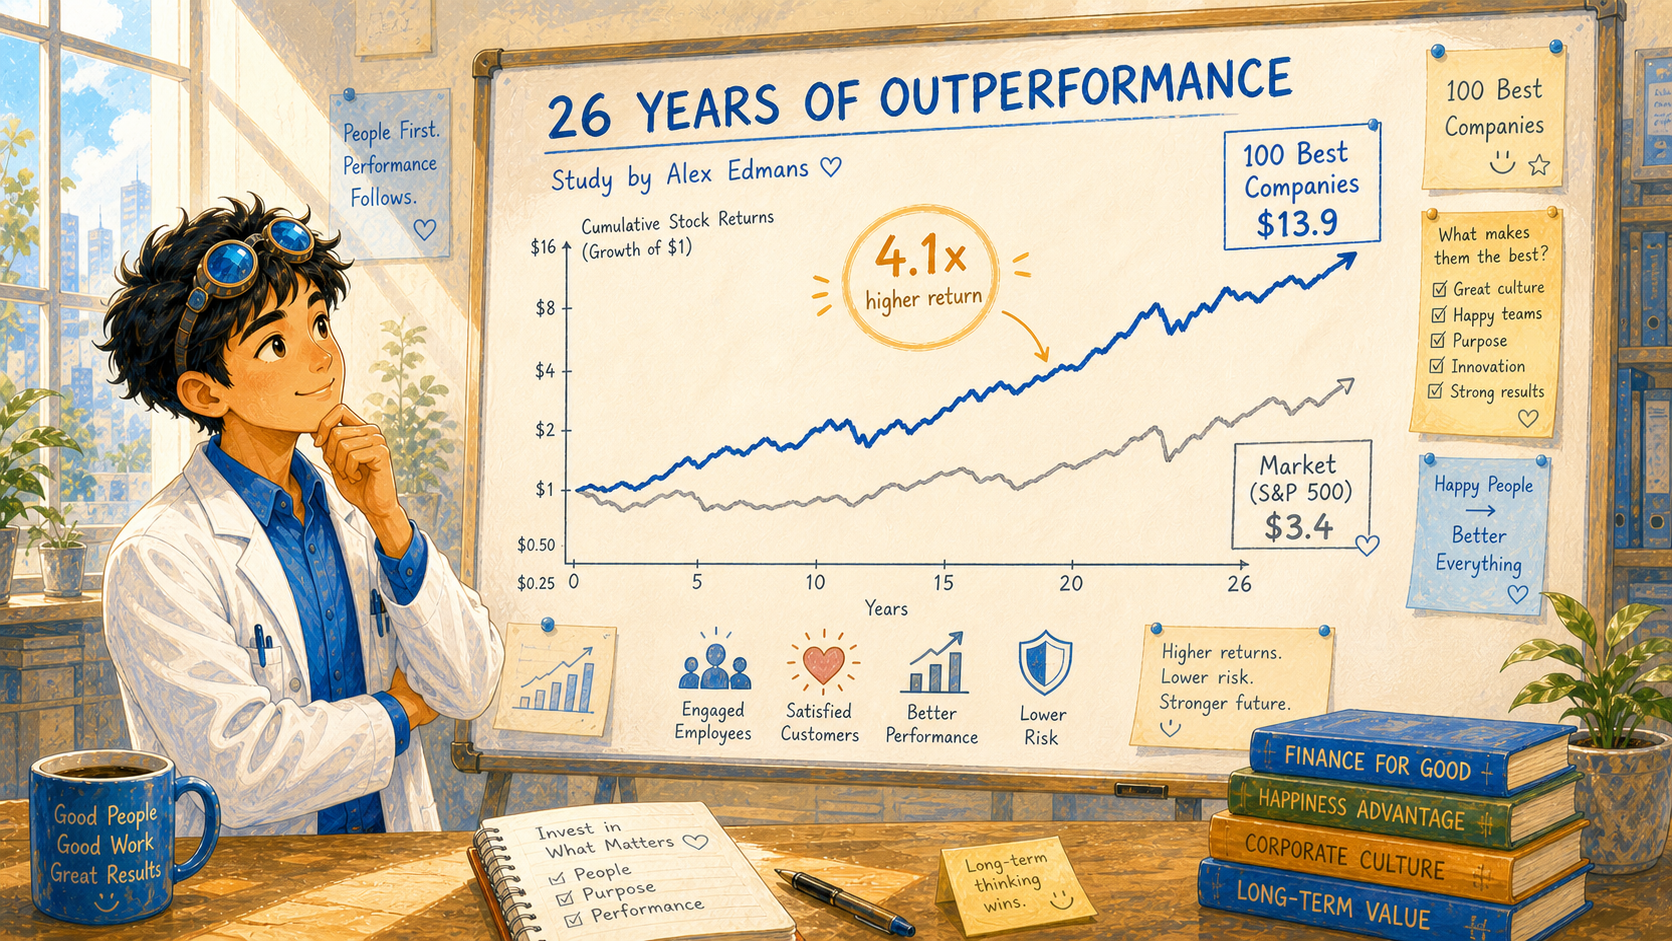
The 100 best companies beat the market
Happier-rated companies systematically outperform the market on a risk-adjusted basis over decades — and the cleanest test of this comes from Alex Edmans at London Business School. He started with the Fortune "100 Best Companies to Work For in America" list and tracked their stock returns over 26 years (1984–2009). In his published work, the 100 Best portfolio beat the broader market by 2.1% to 3.5% per year, on a risk-adjusted basis. Over 26 years, that compounds into a very large gap.
What I respect about the design is that the 100 Best list is constructed independently of any financial criterion. The list cares about employee experience, not about return on capital. So if happier-rated companies systematically outperform, that's a signal that's not downstream of obvious management quality.
Innovation tracks employee-friendliness
Employee-friendly workplaces don't just spend more on innovation — they get more output per dollar spent. Two papers in the Journal of Corporate Finance in 2016 found that workplaces measured by HR-practice indices independent of financial performance invest more in research and development and achieve more innovative output, measured by patent counts and citations relative to R&D spend. The efficiency gain is the part that matters: it isn't just bigger budgets; it's better R&D yield.
Adversity is where the gap shows up most
The University of Michigan's Center for Positive Organizations has documented this across multiple case studies — happier organizations recover from setbacks, product flops, accidents, even natural disasters faster than peer organizations with similar resources. The interpretation that fits the data: happier organizations have stronger relational infrastructure, which is the part of a company that gets tested when the formal infrastructure breaks.

Talent retention is where the math gets dramatic
Wright & Bonnet's 2007 Journal of Applied Psychology study reported that a single one-point increase on a standard happiness scale roughly doubled an employee's probability of staying in the job. Doubling. From a one-point shift.
Gallup, in their report The Economics of Wellbeing by Tom Rath and Jim Harter, puts the cost side in dollars: thriving employees have 35% lower turnover costs than struggling employees and 52% lower than suffering employees, controlling for demographics. For every 10,000 employees, that single difference represents about $19.5 million in turnover savings. And on the health side of the same dataset, thriving employees have 41% lower health-related costs than struggling employees and 62% lower than suffering employees.
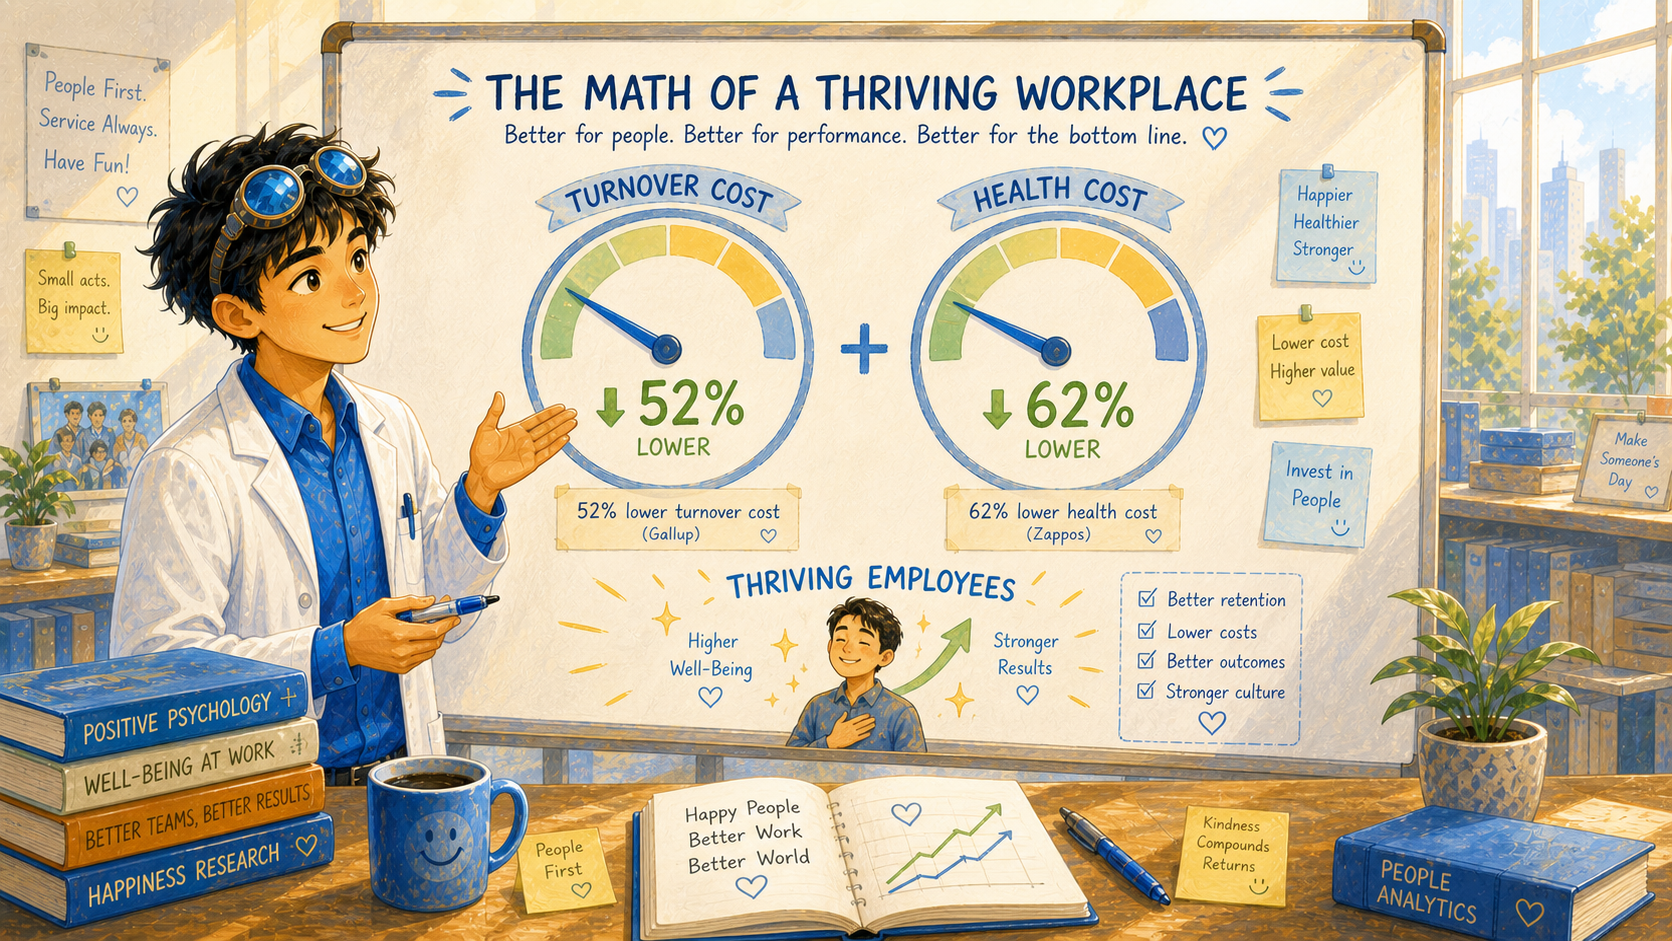
Translation: the per-employee dollar return on a one-point happiness lift is large enough to fund the very programs that produce that lift, several times over. The case for investing in happiness doesn't require optimism — it requires arithmetic.
Productivity at the firm level
A 2012 study in Industrial and Labor Relations Review found that increases in workplace happiness predicted a 6.6% rise in value-added per hour worked in manufacturing — a sector where the productivity number is unusually well-measured because output is physical and countable.
That last detail matters. Manufacturing output is counted in physical units, not survey responses, so the gain can't be explained away as happier employees just rating themselves higher. Whatever happiness is doing here, it's showing up on the loading dock.
A 2019 Oxford report ties it all together
The most recent stitch in the literature is Krekel, Ward & De Neve's 2019 Saïd Business School working paper Employee Wellbeing, Productivity, and Firm Performance. Across multiple large-scale datasets, they document the same pattern at the firm level: higher employee well-being predicts higher productivity and higher firm-level financial performance, with the strongest effects in customer-facing industries.
The 2019 paper matters because it's the one most insulated from the older "happy companies have better PR" objection — it uses panel data with firm fixed effects, so it's tracking changes within the same company over time, not just comparing high-happiness companies to low-happiness ones cross-sectionally.
A UK panel from a different research group finds the same shape
A separate group reached a similar conclusion in different data. Bryson, Forth & Stokes (2017) in Human Relations used linked employer-employee data across British workplaces and found a clear, statistically significant relationship between average workplace job satisfaction and workplace performance — present in both cross-sectional and panel analyses, robust across multiple model specifications. They explicitly tested job-related affect and job satisfaction separately; the satisfaction effect held up, the affect effect didn't.
That last detail matters for how we read the rest of the literature. "Happiness at work" is not one variable — and the part that predicts firm performance most cleanly is the evaluative component (job satisfaction), not the moment-to-moment component (affect).
Jennifer Aaker's case-study lens
Stanford's Jennifer Aaker's Business Case for Happiness takes the same evidence and walks it through specific companies that built happiness-oriented programs and reported corresponding gains in customer satisfaction, retention, and revenue. The case-study format complements the panel-data work — it shows the mechanism inside individual firms, where the panel data only shows the average.
"But isn't this all just well-managed companies?"
This is where I want to lead with what the skeptic gets right, before defending the thesis.
What the skeptic gets right
The strongest version of the skeptical case is Bowling's 2007 Journal of Vocational Behavior meta-analysis, which asks whether the satisfaction-performance relationship is spurious. His answer: largely yes. After controlling for personality traits (Big Five, core self-evaluations) and organization-based self-esteem, the residual correlation drops from roughly .30 to .16, and falls further toward zero with full controls. Translated: a meaningful chunk of "happy workers perform better" is really "people with stable, agreeable, high-self-esteem dispositions both report happiness and perform better." The disposition is doing some of the work the survey is crediting to happiness.
That's a real concession. The 1985 Iaffaldano & Muchinsky meta-analysis already found r ≈ .17, and Bowling's 2007 work argues even that small correlation is mostly explained by traits the workplace didn't put there. The skeptic's case has been getting sharper over time, not weaker.
A second concession is worth naming. Buckingham & Goodall's Nine Lies About Work (HBR Press 2019) argues engagement is fundamentally team-level, not company-level — which means firm-level outperformance figures (like Edmans's 100-Best premium) may be aggregating over enormous within-company variance. They're right that a single company-wide engagement score is the wrong unit of observation.
Same shape as the correlation–causation worry I covered in the seven-problems post: happy companies and high-performing companies overlap because both are downstream of competent management, fair pay, and stable demand — and now, additionally, because of stable individual personality traits that surveys don't separate out.
What's still standing
So what's left of the offensive case once those concessions land?
First, the experimental studies don't have the spuriousness problem. Oswald's 12% productivity bump and Isen's candy-physician improvement aren't comparing high-trait people to low-trait people — they're comparing the same person before and after a small mood manipulation. Random assignment to a positive-affect condition removes the personality-trait confound by construction. That's the part of the literature Bowling's critique can't reach.
Second, Cropanzano & Wright's 2001 Consulting Psychology Journal review refines what we should be measuring. They show that the satisfaction-performance correlation is weak, but the well-being-performance correlation is meaningfully stronger. Bowling's spuriousness finding chips away at the satisfaction side; the well-being side is where the action is. The 2017 Bryson/Forth/Stokes UK panel above explicitly separates these two and finds the same split.
Third, Edmans's 26-year stock-return finding uses a list (Fortune's "100 Best Companies to Work For") constructed without reference to financial performance. If happiness-rated companies systematically outperform on a risk-adjusted basis over a quarter-century, that's not the type of finding well-managed companies can produce by accident — and the firm-fixed-effects design in the 2019 Krekel/Ward/De Neve paper closes the within-company-variance loophole that Buckingham & Goodall flag.
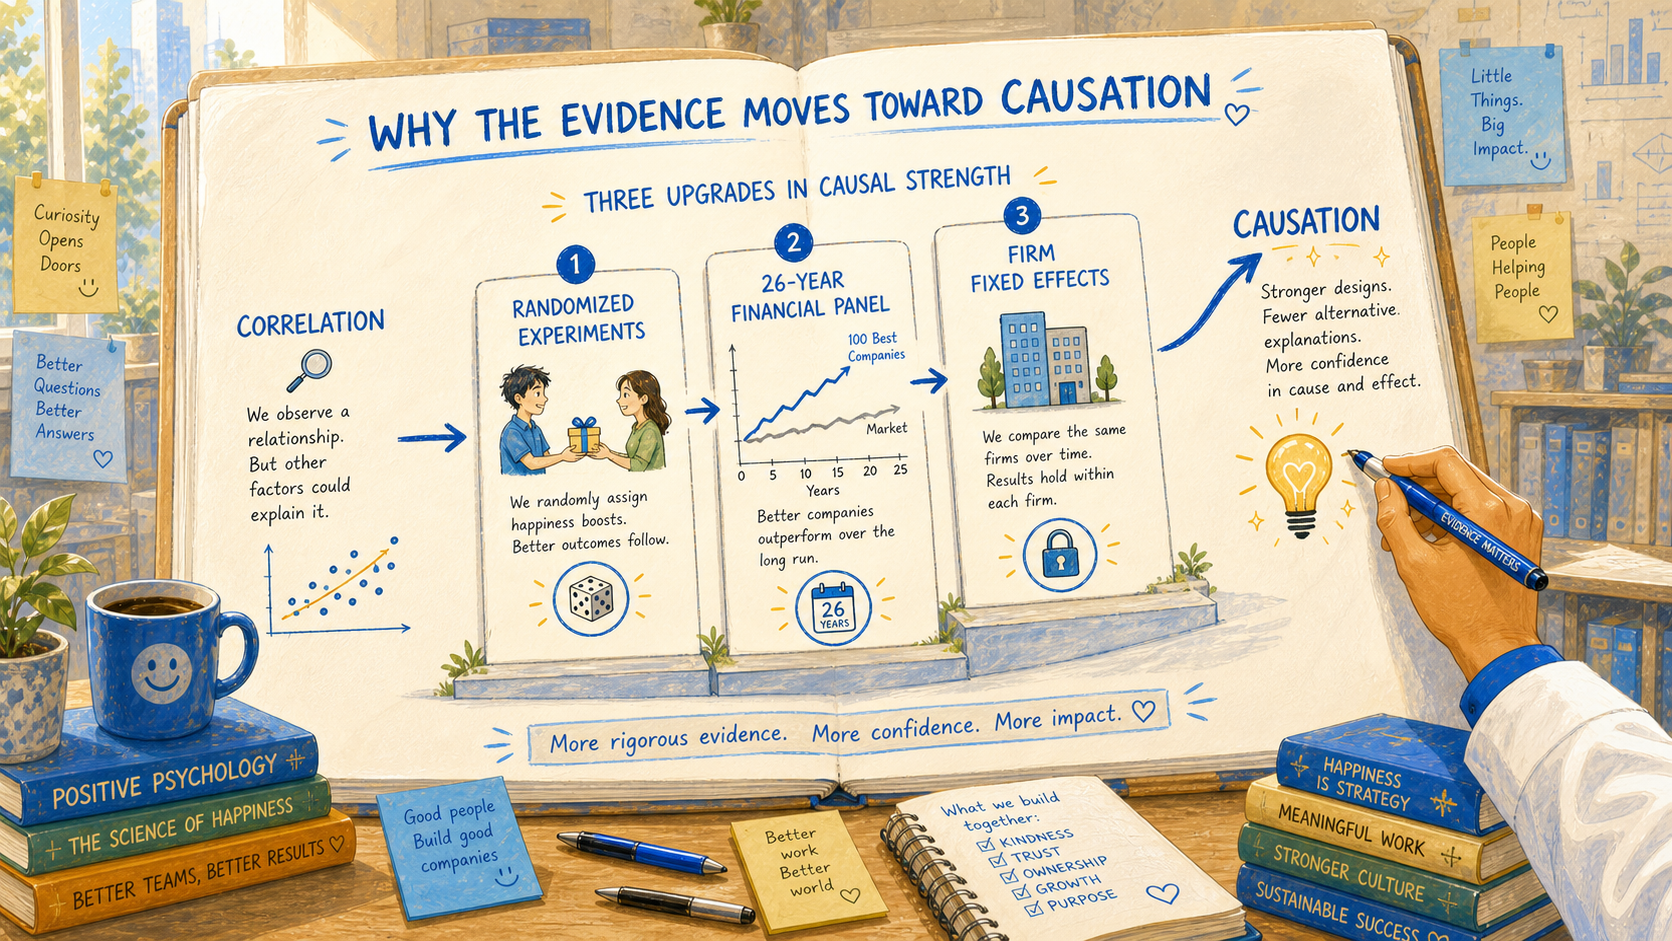
The point isn't that the skeptic is wrong everywhere. It's that the skeptic is right about satisfaction surveys at the company level and largely right about cross-sectional correlations, but the offensive case mostly rests on experiments and within-company panel data, which are different evidence and don't share the same confounds.
A separate concession worth keeping from the seven-problems post: Jeffrey Pfeffer's Dying for a Paycheck is right that companies sometimes use happiness branding to dodge fixing real conditions like overwork and pay. Reading the offensive case shouldn't make anyone forgive that. The right move is to do both — fix the conditions and invest in the levers that compound on top of them.
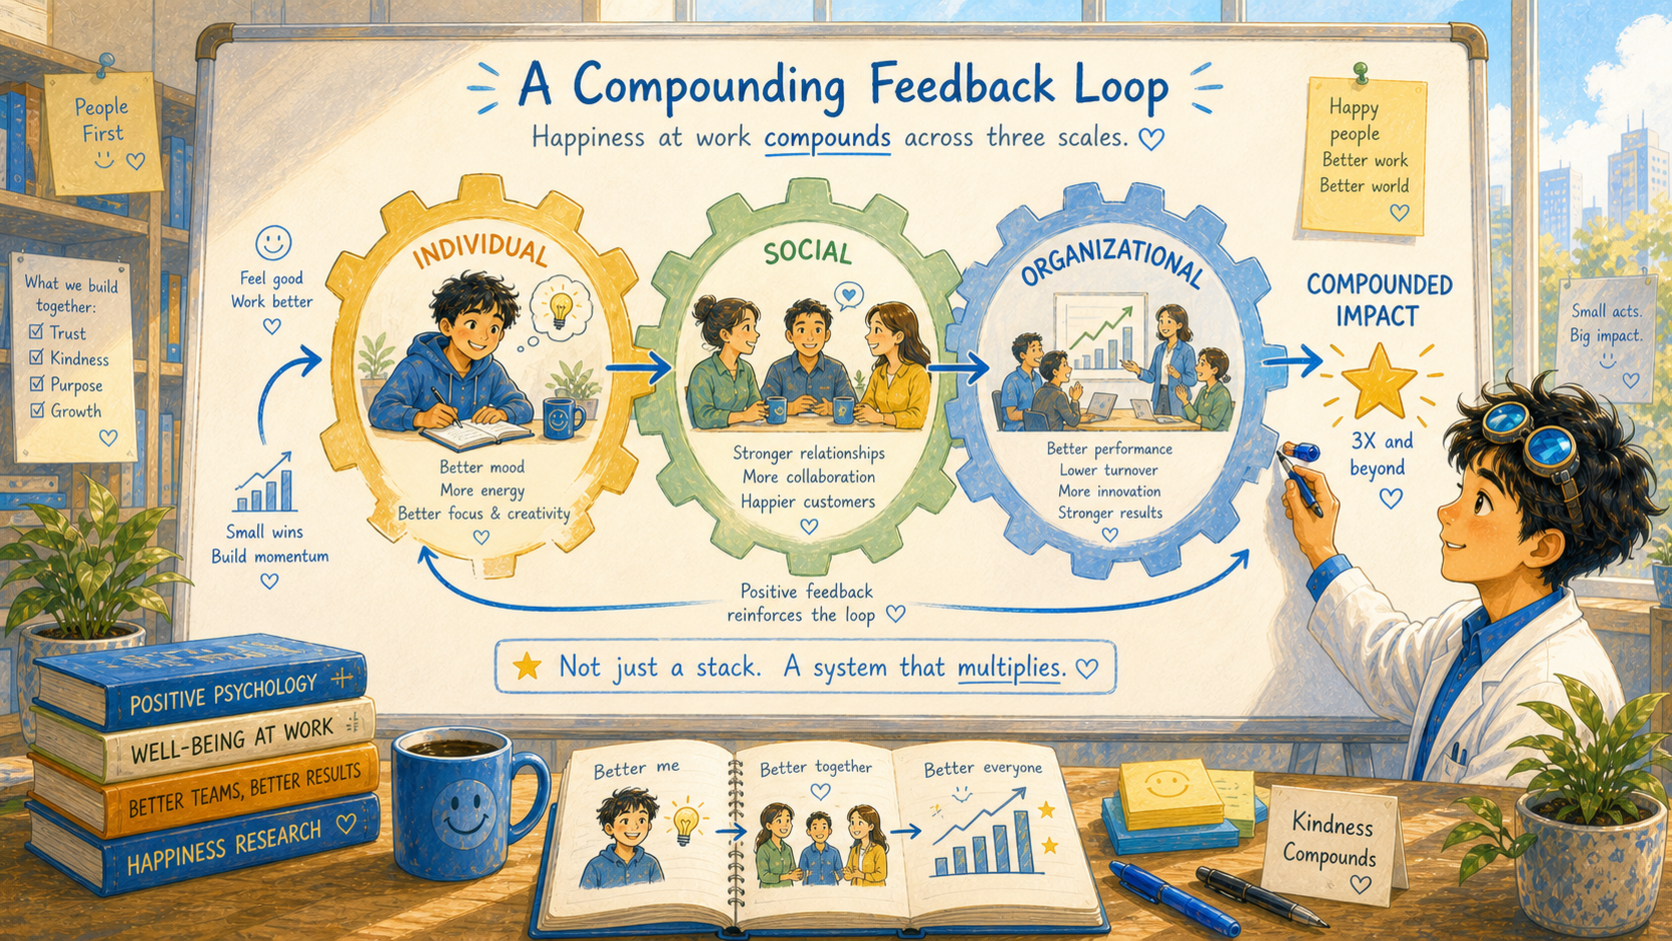
Why the three scales compound rather than just stack
Stepping back, the thing that ties this post together — and the part that got overlooked when I first read the lecture — is that the three scales don't add up linearly. They feed each other.
A more creative individual makes a better collaborator. A better collaborator helps build a more functional team. A more functional team produces a more retained, more innovative organization. And a more retained, more innovative organization is a place where the next individual gets to do more meaningful work, recover faster, and stay longer — which feeds back into the individual scale. It's a loop, not a list.
That's the structural reason a single one-point happiness shift can double retention, or a small mood manipulation can lift productivity by 12%. The same nudge moves three layers at once.
So what would you actually measure first?
If happiness compounds across three scales, then the bottleneck question isn't whether happiness pays off — it's which scale your organization is leaving on the table. The PERK self-assessment from Berkeley's Greater Good Science Center — the same lab whose lectures this series is built on — gives one concrete next step: their Happiness at Work quiz scores you on Purpose, Engagement, Resilience, and Kindness, the four pillars I covered in the PERK deep-dive post. At the team level, Gallup's Q12 is the field-standard instrument; the items are proprietary, but the dimensions they cover — clarity of expectations, recognition, growth, belonging — line up with what the research above predicts.
Neither tool is a complete program. But picking one and running it on a real team is more useful than reading another article on whether happiness "matters."
A few things I'm taking away
- Mild positive affect changes brain chemistry in measurable ways: Ashby, Isen & Turken's 1999 dopamine theory predicts the cognitive flexibility, working memory, and creative problem-solving gains that show up in dozens of follow-up experiments
- Alice Isen's candy-physician study isn't a metaphor — practicing physicians given a small candy bag made faster and more accurate diagnoses, and resisted misleading information better
- Andrew Oswald's 2015 randomized lab experiments showed about a 12% productivity bump from a small positive-mood manipulation, with no equivalent gain from arousal alone
- Teresa Amabile's Progress Principle reframes motivation around small daily wins — one finished task can lift creativity for days, and supervisors independently rate happier employees as more creative
- Schwartz's satisficing-vs-maximizing line explains why happier people recover faster: they're often making different decisions, not just feeling different about the same ones
- Lyubomirsky's longitudinal work shows happiness predicts higher income years later — the arrow runs from happiness to success more often than the other way
- Amy Colbert's 2016 paper documents that happier coworkers are rated more competent by peers, not less — the happy-go-lucky stereotype is wrong on the data
- Gallup's Jim Harter shows that business units with higher employee engagement achieve roughly 10% higher customer ratings — internal happiness is felt externally
- Alex Edmans's 26-year tracking of Fortune's "100 Best Companies" found a 2.1–3.5% per-year risk-adjusted return premium over the broader market, a list constructed without any financial criterion
- Wright & Bonnet's one-point happiness shift roughly doubles retention probability, and Gallup's Economics of Wellbeing puts the per-employee turnover and health-cost gaps in dollar terms
- The 2019 Krekel, Ward & De Neve report uses firm fixed effects to confirm the same pattern at the firm level — it's not just well-managed companies hiring happier people
- Bryson, Forth & Stokes (2017) reach the same conclusion in UK linked employer-employee data, and explicitly find the effect lives in job satisfaction (evaluative), not job-related affect (moment-to-moment) — those two are not the same variable
- Spreitzer & Porath's 2012 HBR work puts numbers on the social scale: thriving employees show 16% better performance, 125% less burnout, 32% more commitment, and 46% more satisfaction than peers
- Bowling's 2007 spuriousness meta-analysis is the strongest concession on the skeptic's side: most of the satisfaction-performance correlation evaporates after controlling for personality traits — which is why the offensive case rests on experiments and within-company panel data, not cross-sectional satisfaction surveys
- Buckingham & Goodall are right that engagement is mostly team-level, not company-level — which sharpens, rather than dissolves, the case for firm-fixed-effects designs like Krekel/Ward/De Neve
- The three scales compound rather than stack: individual gains feed social gains feed organizational gains, and the loop closes back to the individual
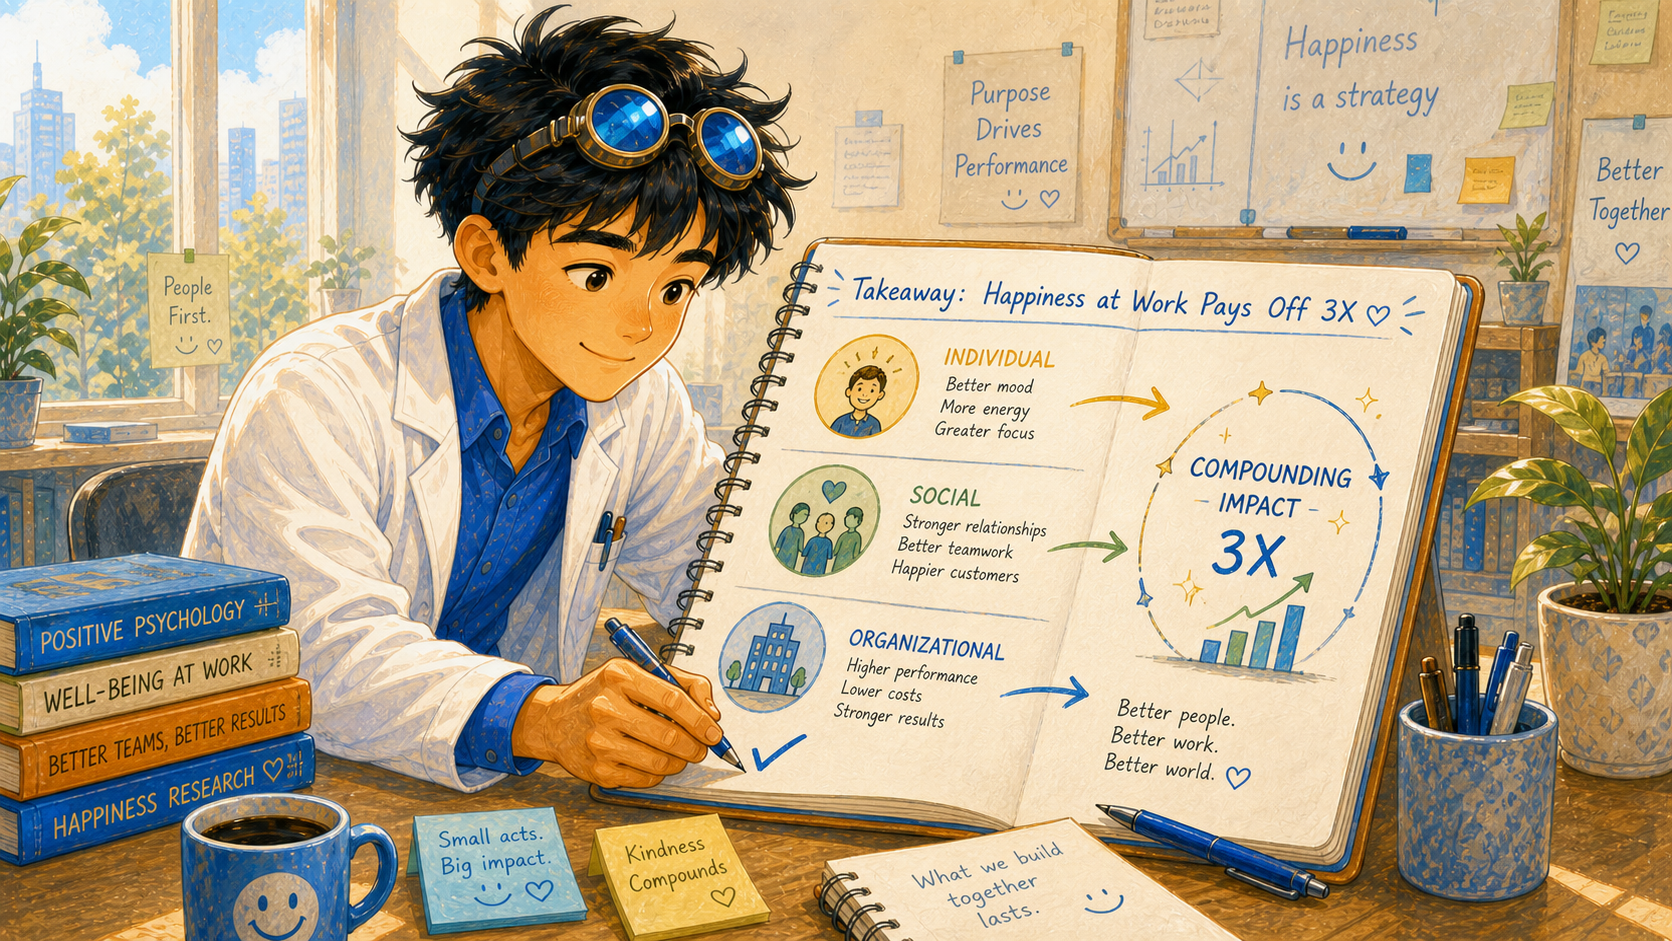
The reframe that stays with me is that the offensive case for happiness at work is structurally different from the defensive case. The defensive case says you'll lose less if you take this seriously. The offensive case says you'll gain more, in places that show up on a balance sheet, on a peer evaluation, and on your own annual physical. Those aren't separate spreadsheets. They're the same person's life, viewed from three different distances.
If the defensive case is a fire alarm, the offensive case is a compounding investment. Most companies are still treating it like neither.
Sources
- Simon-Thomas, E. — Lecture: "What Are the Advantages of Happiness at Work?" Science of Happiness at Work, BerkeleyX. Used for: the three-scale structure (individual, social, organizational) and most of the survey statistics cited
- Ashby, F. G., Isen, A. M., & Turken, U. — A Neuropsychological Theory of Positive Affect and Its Influence on Cognition, Psychological Review (1999). Used for: the dopamine mechanism linking mild positive affect to improved cognitive flexibility, working memory, and creative problem solving
- Isen, A. M., Daubman, K. A., & Nowicki, G. P. — Candle and Remote Associates Test studies, Journal of Personality and Social Psychology (1987); Estrada, Young, & Isen physician diagnostic studies (1994). Used for: the candy-physician finding and the broader claim that randomly assigned positive affect improves creativity
- Oswald, A. J., Proto, E., & Sgroi, D. — Happiness and Productivity, Journal of Labor Economics (2015). Used for: the ~12% productivity gain from a randomized positive-mood induction
- Amabile, T. — The Progress Principle (Harvard Business Review Press) and HBR essay "The Power of Small Wins." Used for: the small-wins claim and supervisor evaluations of creativity
- Schwartz, B. — The Paradox of Choice (Swarthmore). Used for: the satisficing-vs-maximizing distinction and its tie to well-being and decision quality
- Lyubomirsky, S. — The How of Happiness (Penguin). Used for: the longitudinal claim that happiness predicts later income and career success
- Colbert, A. E., Bono, J. E., & Purvanova, R. K. — Flourishing via Workplace Relationships, Academy of Management Journal (2016). Used for: the peer-rating advantages of happier coworkers (warmth, trust, competence) and supervisor evaluations
- Carnevale, P. J., & Isen, A. M. — Integrative-bargaining study, Organizational Behavior and Human Decision Processes (1986). Used for: the negotiation finding that positive affect produces more joint-gain solutions
- Salovey, P., & Mayer, J. — Foundational emotional-intelligence work (1990). Used for: the asymmetry in helping behavior toward people with a positive outlook
- Harter, J. — Gallup Business Journal and State of the American Workplace (2017). Used for: the ~10% customer-rating advantage in highly engaged business units
- Edmans, A. — Does the Stock Market Fully Value Intangibles? Employee Satisfaction and Equity Prices, Journal of Financial Economics (2011) and follow-up 26-year analysis. Used for: the 100 Best Companies risk-adjusted return premium
- Two papers in Journal of Corporate Finance (2016) on employee-friendly workplaces and innovation (R&D spend, patent counts, citations). Used for: the innovation-output finding
- University of Michigan Center for Positive Organizations — case-study and book series. Used for: the adversity-rebound finding in happier organizations
- Wright, T. A., & Bonett, D. G. — Job Satisfaction and Psychological Well-Being as Nonadditive Predictors of Workplace Turnover, Journal of Management (2007). Used for: the one-point happiness shift roughly doubling retention probability
- Rath, T., & Harter, J. — The Economics of Wellbeing (Gallup Press, 2010). Used for: the 41–62% health-cost differential and 35–52% turnover-cost differential between thriving and struggling/suffering employees
- Industrial and Labor Relations Review (2012) manufacturing study. Used for: the 6.6% value-added-per-hour gain from rising workplace happiness
- Krekel, C., Ward, G., & De Neve, J.-E. — Employee Wellbeing, Productivity, and Firm Performance, Saïd Business School Working Paper (2019). Used for: the firm-fixed-effects evidence that within-company well-being changes predict within-company productivity and financial performance
- Aaker, J. — The Business Case for Happiness, Stanford Graduate School of Business. Used for: the case-study lens on happiness-oriented programs in specific firms
- Pfeffer, J. — Dying for a Paycheck (Stanford GSB). Used for: the partial concession to the skeptic — companies do sometimes use happiness branding to mask un-fixed conditions
- Achor, S. — The Happy Secret to Better Work, TEDxBloomington (2011). Used for: the most aggressive public version of the "happiness causes success" thesis, embedded after the post's bolded claim
- Spreitzer, G., & Porath, C. — Creating Sustainable Performance, Harvard Business Review (Jan-Feb 2012). Used for: the thriving framework and the 16% / 125% / 32% / 46% performance, burnout, commitment, and satisfaction differentials
- Bryson, A., Forth, J., & Stokes, L. — Does employees' subjective well-being affect workplace performance?, Human Relations 70(8) (2017). Used for: the third firm-level pillar of the offensive case, and the satisfaction-vs-affect split
- Bowling, N. A. — Is the job satisfaction–job performance relationship spurious? A meta-analytic examination, Journal of Vocational Behavior (2007). Used for: the lead concession in the counterargument section — most of the satisfaction-performance correlation is explained by personality traits
- Cropanzano, R., & Wright, T. A. — When a "Happy" Worker Is Really a "Productive" Worker: A Review and Further Refinement of the Happy-Productive Worker Thesis, Consulting Psychology Journal (2001). Used for: the well-being-vs-satisfaction distinction that lets the offensive case survive the spuriousness critique
- Buckingham, M., & Goodall, A. — Nine Lies About Work (HBR Press, 2019). Used for: the secondary concession that engagement is team-level, not company-level
- Greater Good Science Center, UC Berkeley — Happiness at Work PERK self-assessment quiz. Used for: the closing "now what" — a concrete next step the reader can act on
- Gallup — Q12 Employee Engagement Survey. Used for: the field-standard team-level instrument named alongside the PERK quiz
Part 5 of 5 in "Happiness at Work"